Stockholm transit during COVID-19: Income and the ability to work from home
Using tidiverse and ggplot2 to illustrate how income inequality manifested during the COVID-19 pandemic
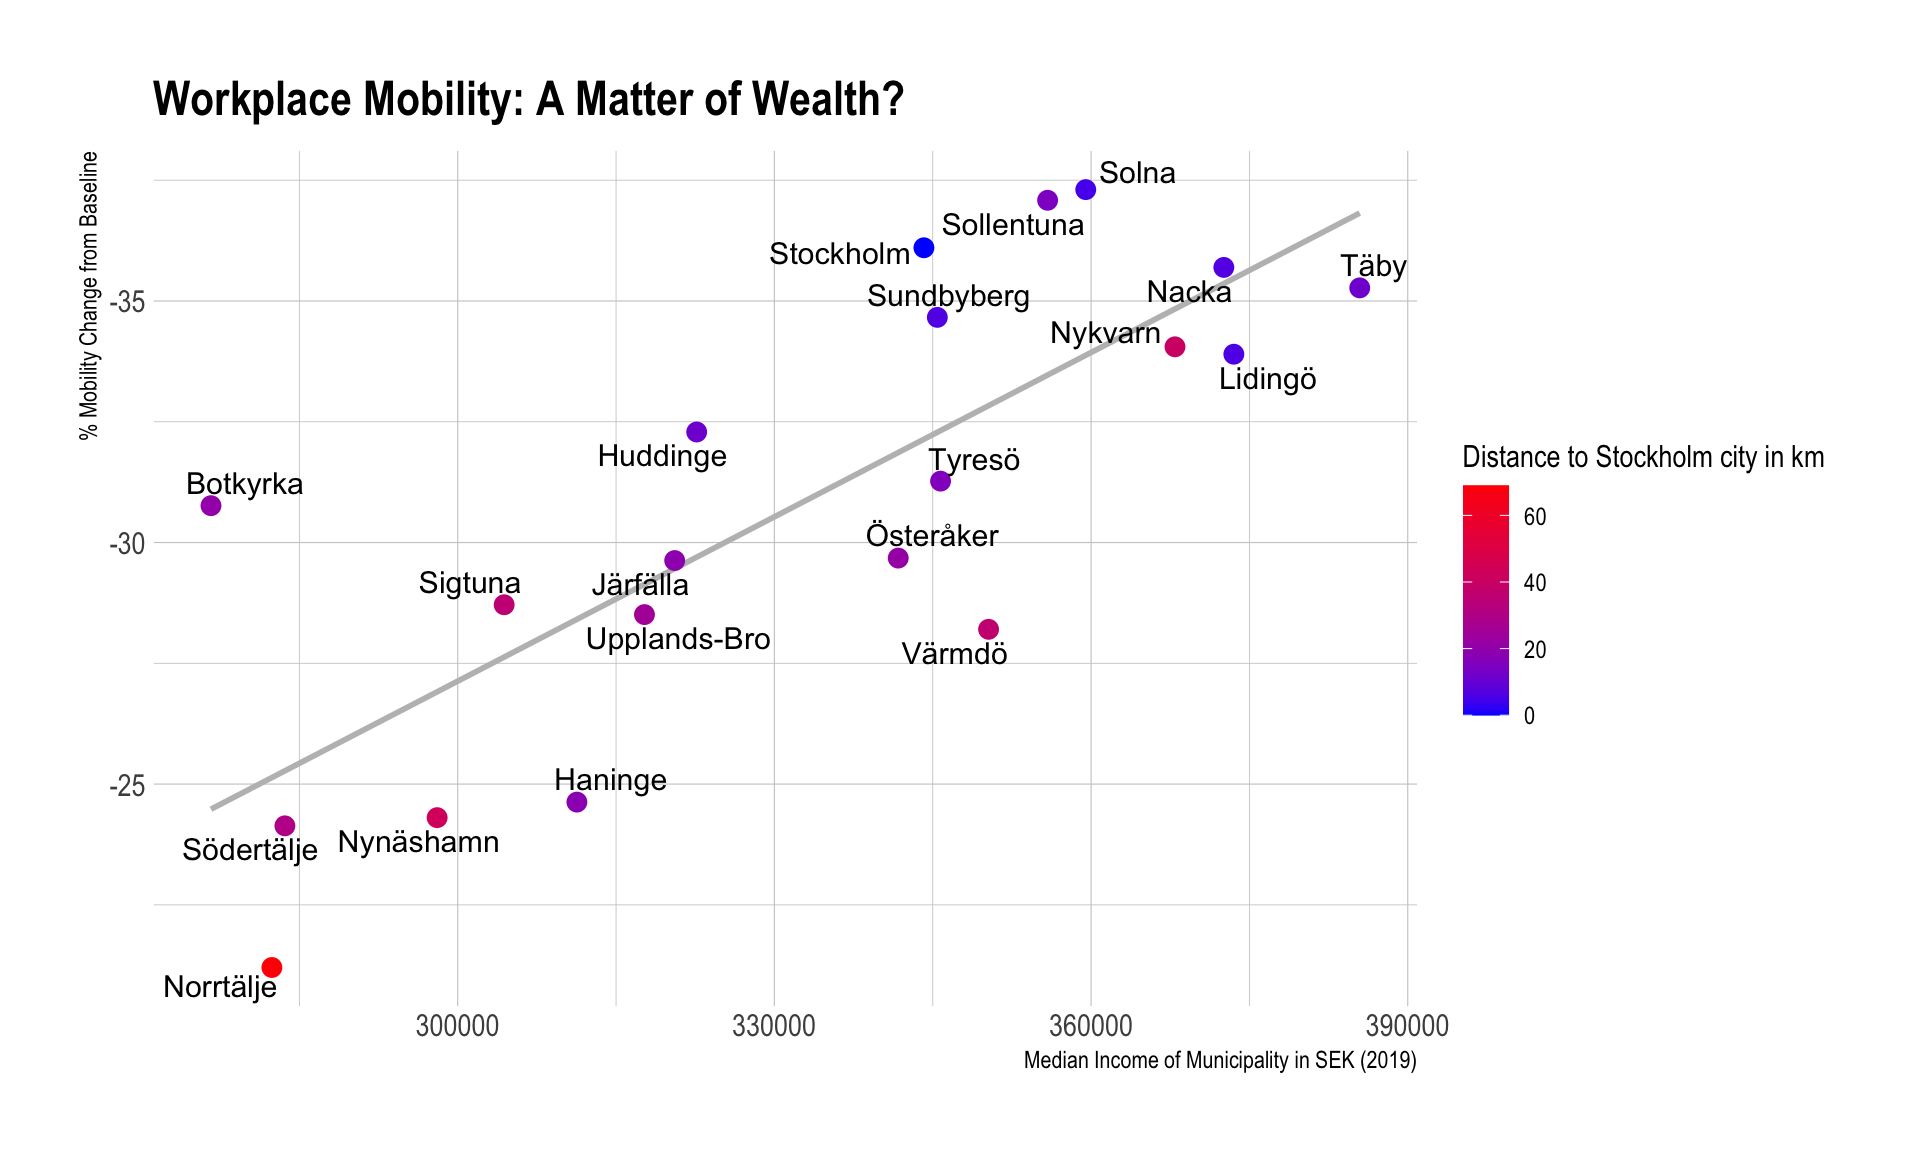
Out of curiosity, I wanted to replicate a friend’s analysis of transit data for London during the COVID-19 pandemic for the greater Stockholm region. However, just one plot in, it was obvious that the ability to work from home might strongly hinge on one’s income situation. So I got some income data for Stockholm’s municipalities and created a few plots that illustrate how inequality manifested during the pandemic.
Have a look at the rendered site here.
If you have any questions or feedback, please don’t hesitate to contact me.